
Using Reports
Reports in BREW POS Admin gives your sales, tax, closeouts and product figures for any period you choose, and saves them as Excel or PDF files. Timecards and payroll have their own screen and are not covered here.
Before you start
This guide is for owners and managers who check sales and hand figures to a bookkeeper. It assumes you already close out the day at the POS and can open a file in Excel.
You need Reports access. If Reports is not in the menu down the left of Admin, ask whoever manages staff to add it to your employee record.
Close out at the POS at the end of each day. Reports are built from those closeouts, as the next section explains.
Two rules that explain most surprises
1. Press Refresh after you change anything
Changing a date, or a button such as Last Week, does not reload the report. The figures on screen stay as they were, with nothing to tell you they are out of date. Press Refresh, the circular arrow at the left of the toolbar, every time.
2. Reports are built from closeouts
Reports counts sales by closeout. If a day was not closed out, its sales roll into the next closeout, whenever that is run. So one closeout can hold more than one day, and the day that was missed shows nothing on its own.
Watch out: a day that was not closed out rolls into the next closeout
The missed day's sales are not lost, but they are counted on the day of the next closeout. That day looks too busy and the missed day looks empty. On the Activity tab, a closeout that holds more than one day is highlighted. Check for highlighted rows before you compare one day with another.
Find your way around
Open Reports from the menu on the left. Along the top are seven tabs, and each tab has its own row of smaller tabs underneath for the breakdown you want (Figure 1). Reports opens on the tab you last used.
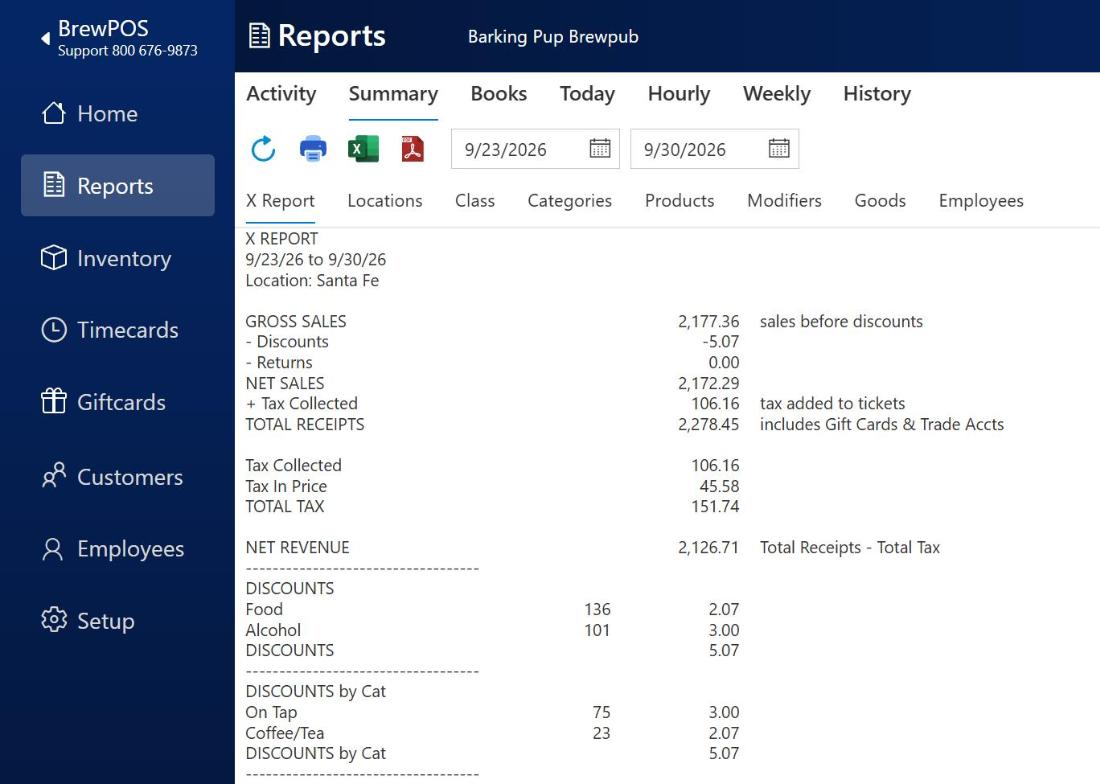
Figure 1. The Summary tab with the X Report open. The toolbar holds Refresh, Print, Export Excel and Export PDF, then the From and To dates
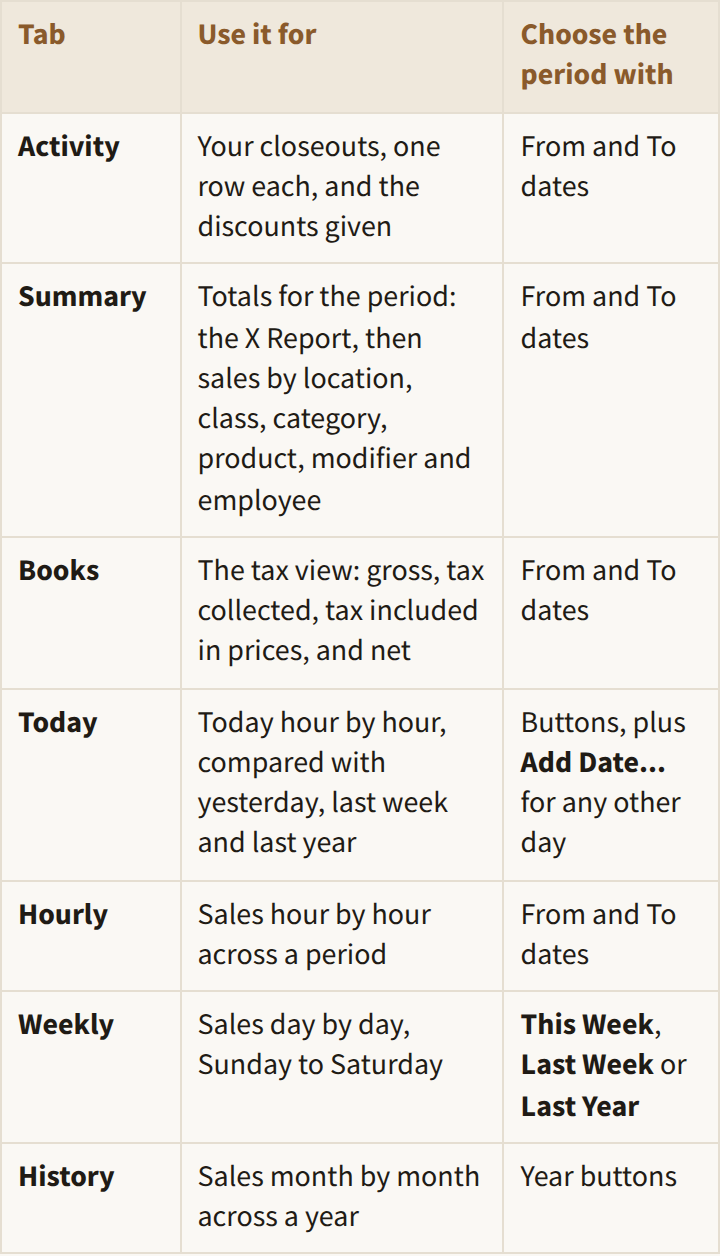
Run a report for a period
This is the same on every tab that has From and To dates.
Click the top tab you want, for example Summary.
Click the smaller tab underneath for the breakdown, for example Categories.
In the first date box, type the first day of the period: 9/23/2026. Or click the calendar at the right of the box and pick the day.
In the second date box, type or pick the last day: 9/30/2026.
Press Refresh. The grid reloads for the new dates (Figure 2). A Total row runs along the bottom of the grid.
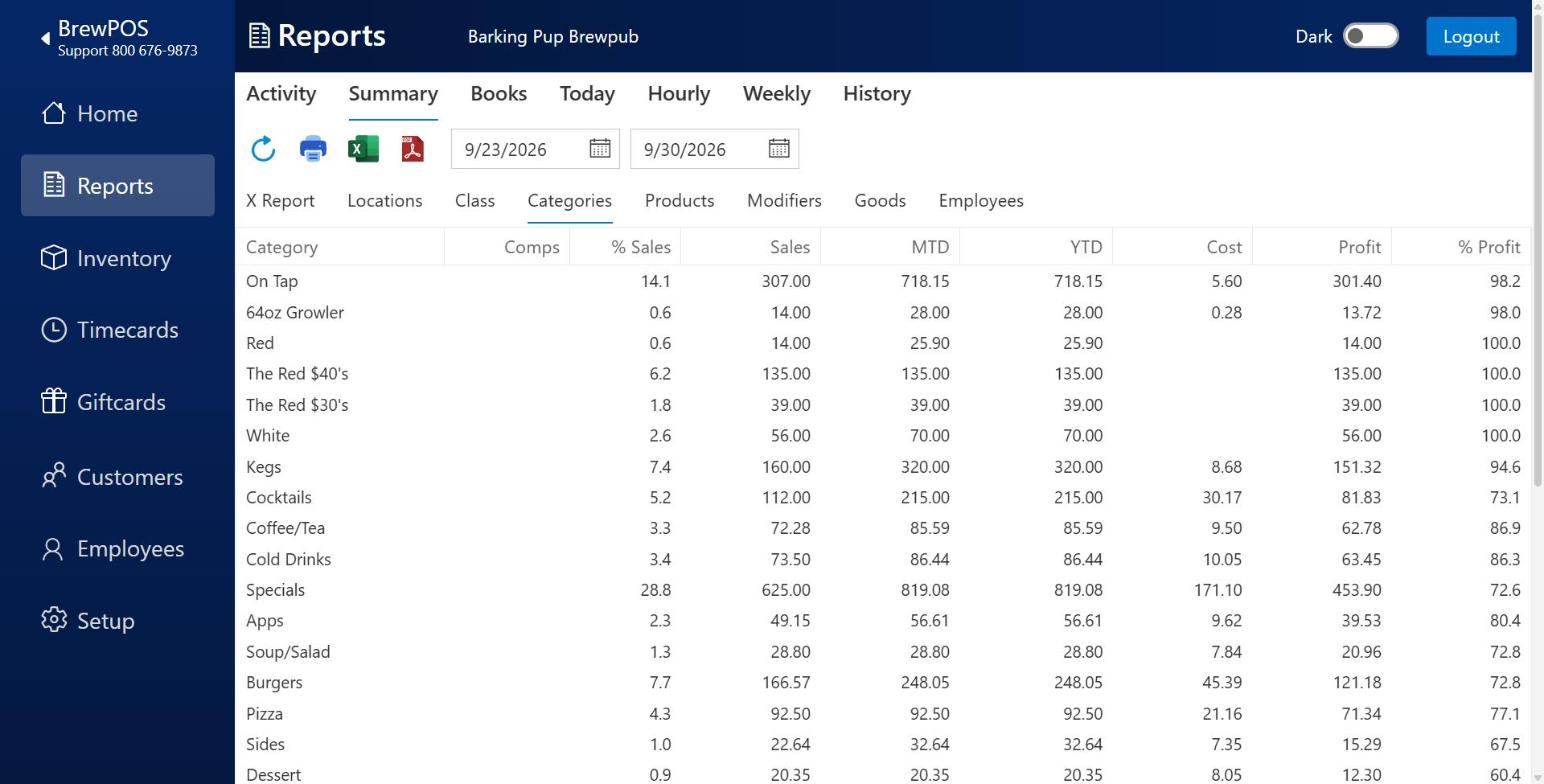
Figure 2. Summary, Categories, for 23 to 30 September after pressing Refresh. MTD and YTD are month to date and year to date
Scroll the grid sideways for more columns. On Categories, the columns after YTD are Cost, Profit and % Profit.
Read the X Report
The X Report, the first smaller tab under Summary, is the whole period on one page (Figure 1). It reads from the top down:
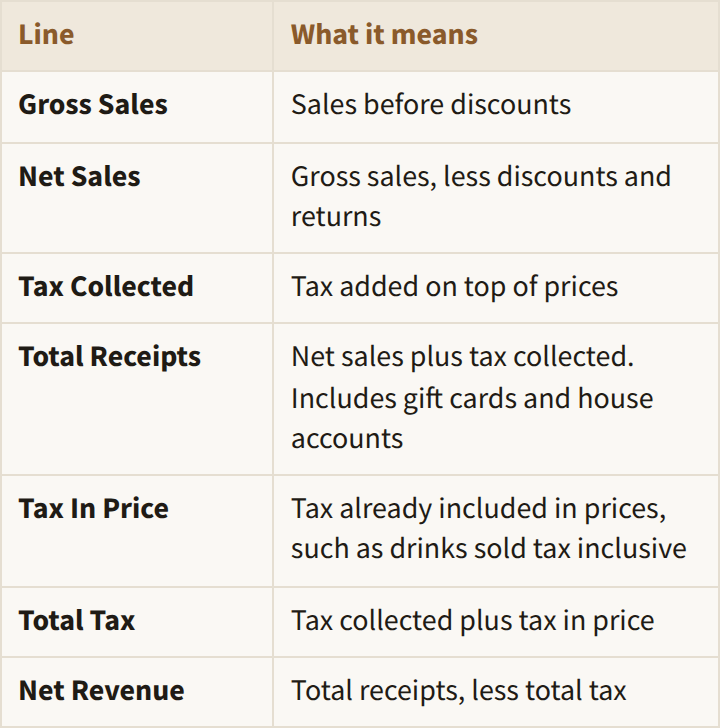
Further down, the X Report lists discounts, net sales and tax by class and category. Then come Payment Methods (cash, credit cards with tips, checks, gift cards, house accounts) and Miscellaneous (returns, voids, comps, waste, guests and average check).
Net Revenue and Income are different figures. Net Revenue is every payment method, less tax and returns. Income, shown on the Activity tab, is cash, credit cards, checks and custom payments including tax. It leaves out gift cards, tabs and house accounts, because a gift card was paid for when it was sold and spending it later is not new income. If a figure looks low, check which of the two you are reading.
Check your closeouts
Click Activity, then Closeouts underneath.
Set the From and To dates.
Press Refresh. Each closeout is one row, with its number, when it was run, and its takings (Figure 3). A highlighted row is a closeout that holds more than one day, because a day before it was not closed out.
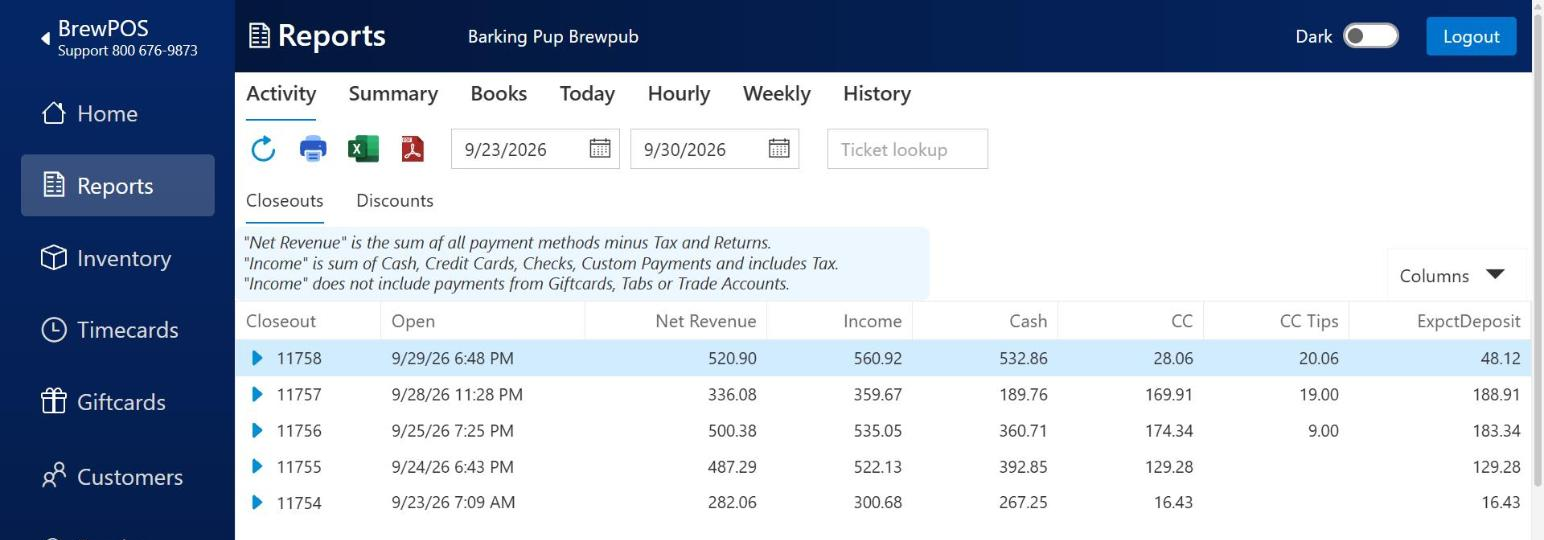
Figure 3. Activity, Closeouts. The note above the grid defines Net Revenue and Income. Scroll sideways for the tips and deposit columns
To see one closeout in full, click the arrow at the left of its row. The closeout report opens in place of the tabs (Figure 4). It has its own row of tabs for drops, shifts, tickets, card payments, products, discounts and more.
Click the X at the top right to go back to the list.
The closeout report has its own Print, Export Excel and Export PDF buttons, so you can save one closeout on its own.
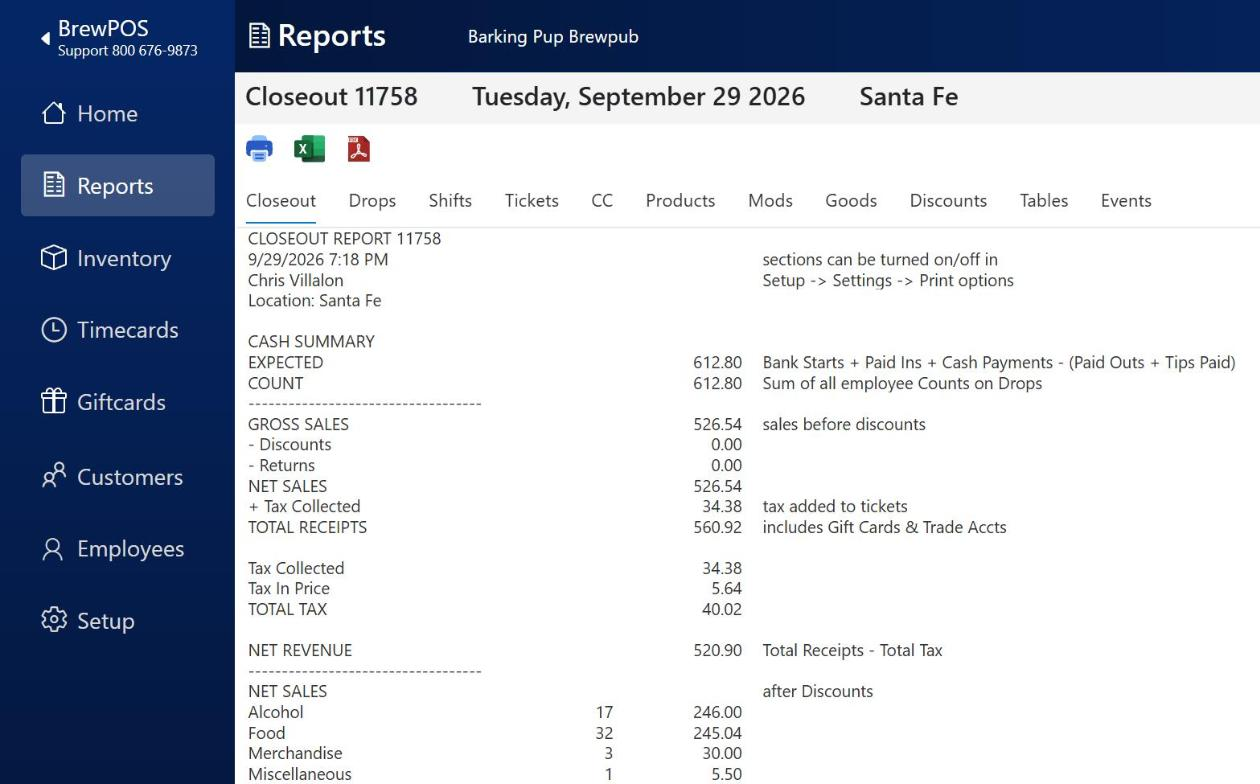
Figure 4. One closeout opened from the list. Expected and Count show whether the cash drawer balanced
The Ticket lookup box on the Activity toolbar opens a ticket straight from its number.
Discounts, the other smaller tab under Activity, lists each discount given in the period, how many times, and how much it took off.
Look up one product
Click Summary, then Products.
Set the From and To dates.
Press Refresh.
To find a product, type part of its name in the Search box on the toolbar, for example Pint, and press Enter (Figure 5).
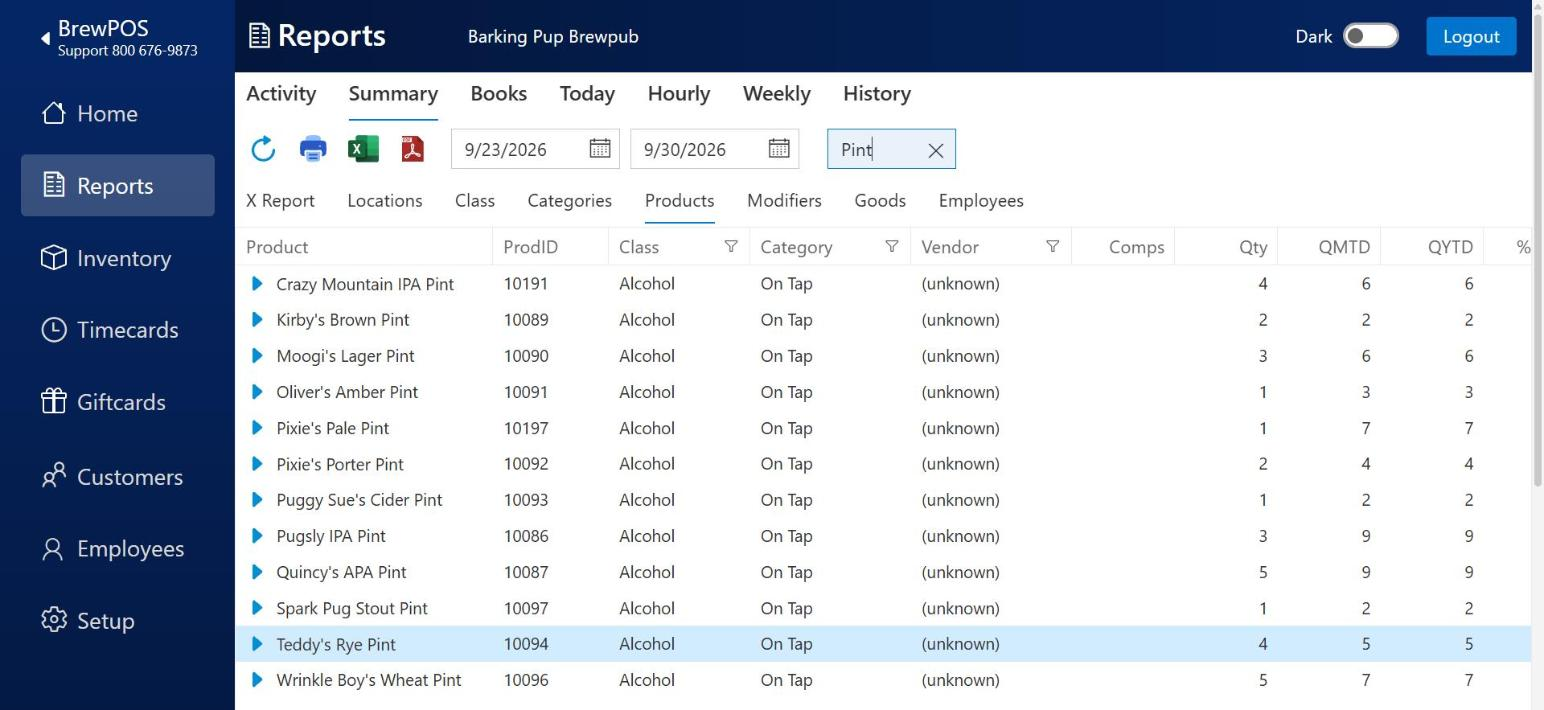
Figure 5. Summary, Products, searched for Pint. The funnels on Class, Category and Vendor filter the list
On the Products list, click the arrow at the left of the product. Product History opens, listing every ticket it was sold on: when, at which workstation, by whom and at which table (Figure 6). It has its own dates, Refresh and export buttons.
Click the X at the top right to go back.
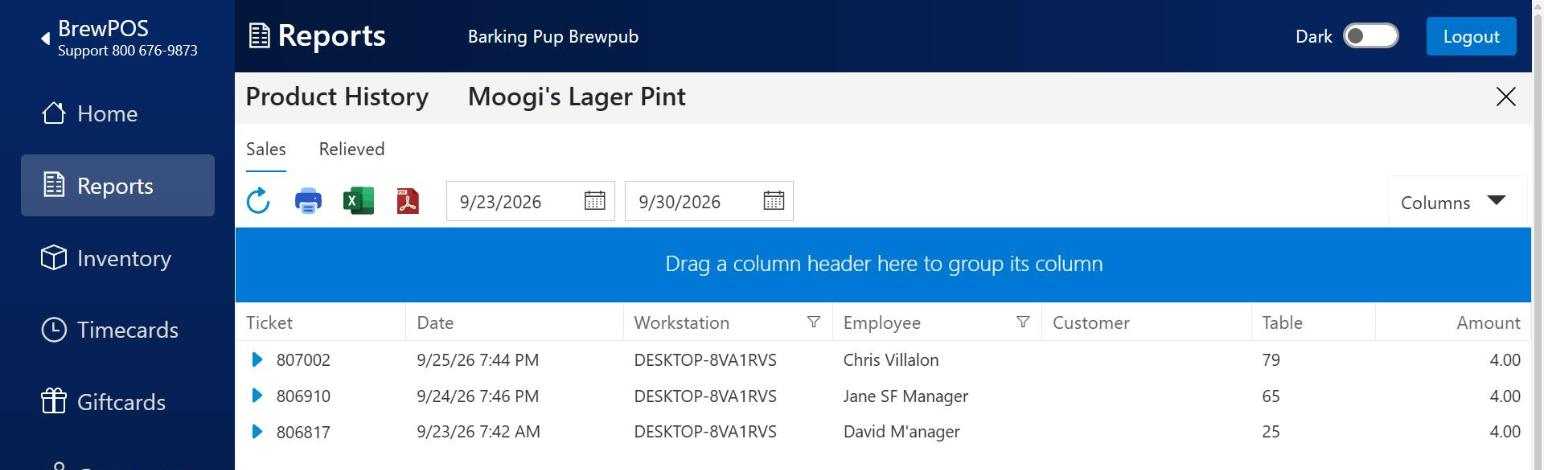
Figure 6. Product History for one product. Drag a column heading into the blue bar to group the list by it
To see the whole product list again, click the x in the Search box.
Modifiers and Goods, next to Products, count modifiers and the products also sold as modifiers. Employees gives each person's tickets, sales, tips, comps, voids and walkouts.
Compare hours, days and months
Hourly spreads the period across the hours of the day, so you can see when you are busy (Figure 7). Set the dates and press Refresh, as for Summary.
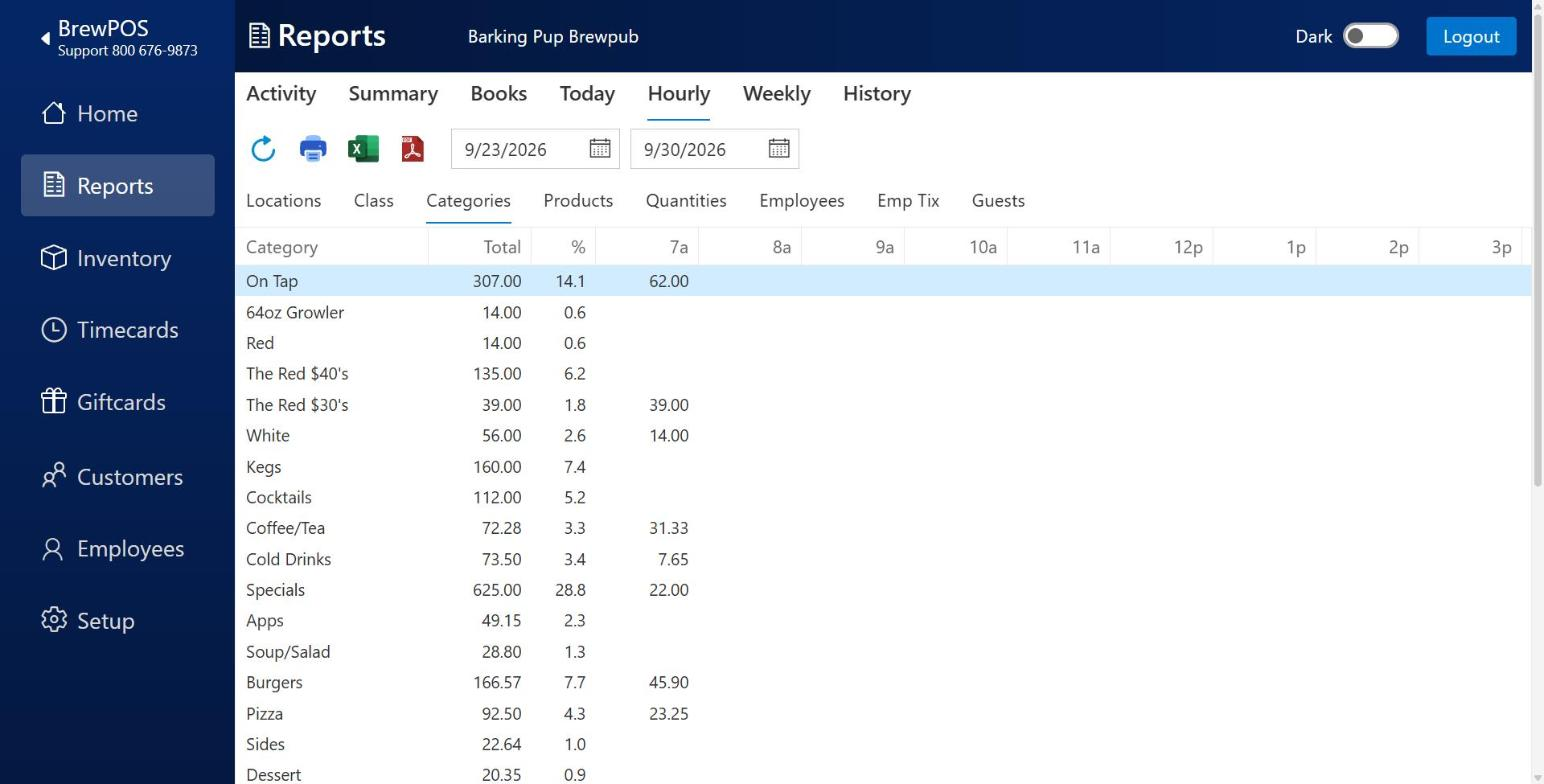
Figure 7. Hourly, Categories. Each column is one hour of the day; scroll sideways for later hours
Weekly lays out one week, Sunday to Saturday.
Click Weekly.
Click This Week, Last Week or Last Year.
Press Refresh (Figure 8).
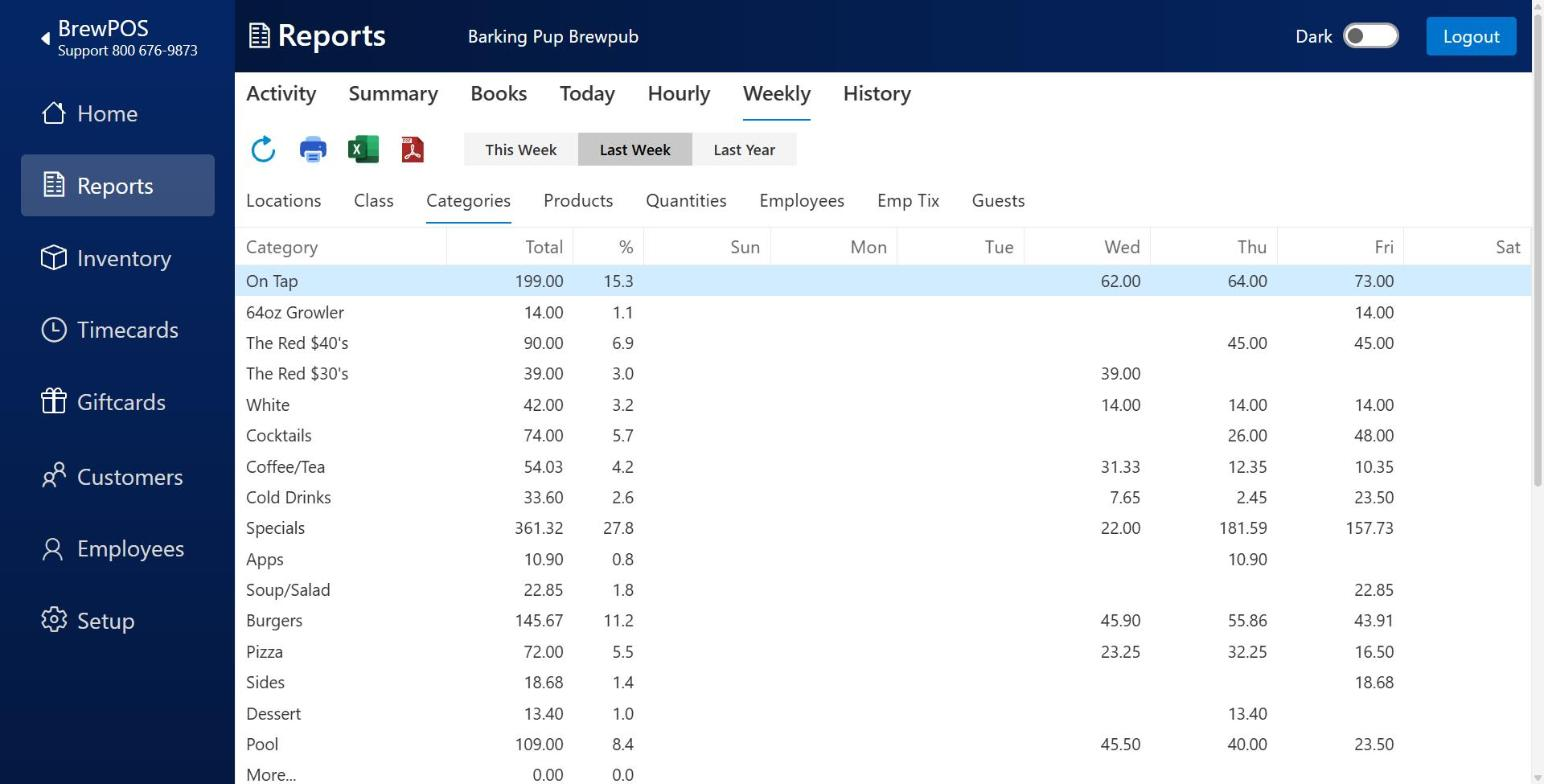
Figure 8. Weekly, Categories, with Last Week clicked and Refresh pressed
History works the same way with year buttons, 2026, 2025 and 2024, and gives January to December.
Today shows today so far, hour by hour, and plots it against yesterday, last week and last year (Figure 9). Add Date... puts another day on the chart for comparison. Before the first sale of the day the grid is empty.
Quantities, a smaller tab under Today, Hourly and Weekly, counts items sold rather than money taken. Use it when ordering stock.
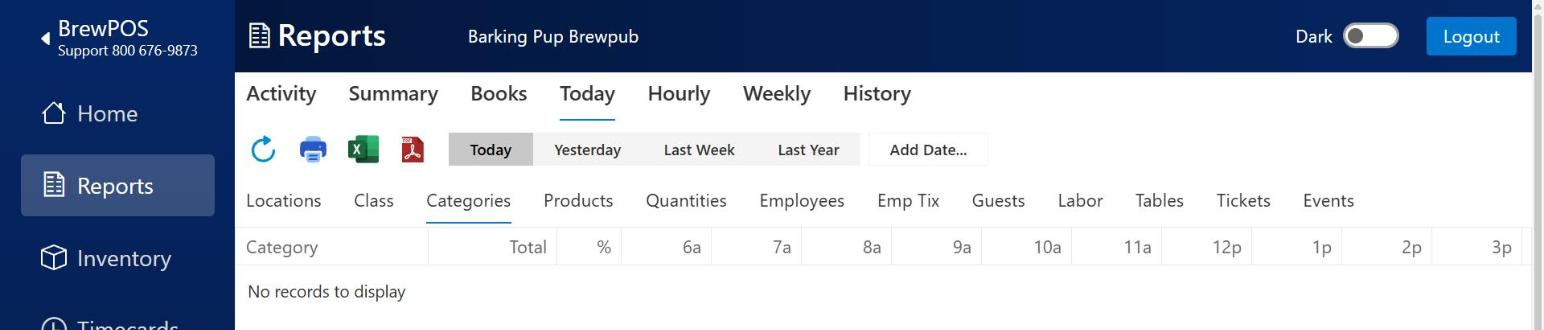
Figure 9. The Today tab before the first sale of the day. Yesterday, Last Week, Last Year and Add Date... pick the days to compare
Get the figures out
Every tab has Print, Export Excel and Export PDF on its toolbar, after Refresh (Figure 1). The file holds what the grid is showing, so get the grid right first.
Set the From and To dates.
Press Refresh.
Optional: on a tab with a Search box or funnels, narrow the list.
If you will work with the numbers further, click Export Excel. For a copy to send or keep, click Export PDF. To print it, click Print.
Open the file from your browser's downloads. Nothing appears on the Reports screen when the file is saved.
The file is named after the tab and the dates, for example Summary - Categories 09-23-26 to 09-30-26.xlsx. Each export is a new file, so run one per breakdown you need.
Excel gives one sheet with the grid's columns, including any you would have to scroll sideways to see. On the X Report, the sheet also has a Notes column with the explanations shown on screen, such as "sales before discounts".
PDF gives one landscape page of the grid.
Some Excel figures are saved as text. Totals, and every amount on the X Report sheet, arrive as text such as 2,172.29, so Excel will not add them up. To turn a column into numbers, select it, then click Data, Text to Columns, Finish.
If something looks wrong
The figures did not change when I changed the dates
Press Refresh.
A report is empty, or a day is missing
Press Refresh first. Then open Activity, Closeouts for the same dates. If the day has no closeout of its own, it was not closed out at the POS, and its sales are in the next closeout. Look for a highlighted row.
Sales show on Timecards but not on Reports
Timecards reads shift records; Reports reads closeouts. If a day shows on Timecards but not on Reports, it was not closed out, and its sales are in the next closeout.
Two tabs give different totals for the same dates
Press Refresh on both, then compare again. If Books still shows fewer days than Summary for the same dates, call BREW POS support on 1-800-676-9874.
About this guide
BREW POS Admin: merchant how-to guide
Applies to: BREW POS Admin, checked against the live application on 30 September 2026.
Last reviewed: 30 September 2026 · Owner: Eddy
BrewPOS How to use
Support 1-800-676-9874
Email [email protected]
© 2026 BREW POS. All rights reserved.